
Last Updated: March 14, 2026
How do you find out what technologies a company actually uses? And I’m not talking about just the frontend stuff, but the real stuff: their CRM, cloud providers, data infrastructure, etc.
The lazy way is to pay for a tool like Wappalyzer or a paid alternative to Wappalyzer. But these tools often miss everything that doesn’t show up in a browser.
I organized 12 techniques from simplest to advanced. The first section requires zero technical skill – anyone can do it. The later sections use advanced technical methods for developers/engineers.
For those interested: I incorporated all of these methods into a tool you can use to get the complete tech stack of any company here (free 5 queries a day).
- 1. Read subprocessor lists and trust centers
- 2. Check their status page
- 3. Analyze historical job postings
- 4. Look at employee LinkedIn profiles
- 5. Check their GitHub, NPM, and Hugging Face repos
- 6. Look up their DNS TXT records
Part 1: Simple methods (no technical skill needed)
1) Read subprocessor lists and trust centers
Let’s start with the easiest trick in this entire guide: just read what companies are legally required to tell you.
If a company handles personal data (especially in the EU), they usually have to disclose every third-party service that touches that data. These are called subprocessors, and companies publish them in plain English, often in a dedicated “Trust Center” (ie using a tool like Vanta) or “Security Center” page.
What you’ll find here is gold: the actual vendors they pay money to. CRMs, cloud providers, analytics tools, payment processors, customer support platforms, marketing automation, email services – basically a receipt of their entire operational stack.
If you’re in sales, this is the fastest way to find out whether a prospect uses a competitor’s product. If their subprocessor list says “Salesforce – CRM and customer data” then you know they’re using Salesforce as a CRM. If it says “Zendesk – customer support” then you know they’re probably not using Intercom. It’s that direct.
Tech startups especially love publishing Trust Centers because it signals to enterprise buyers that they take security seriously (well maybe “love” is too strong a word :). But it means they’ll openly list every SaaS product touching their infrastructure.
Here’s an example from NewDays.ai’s Trust Center:
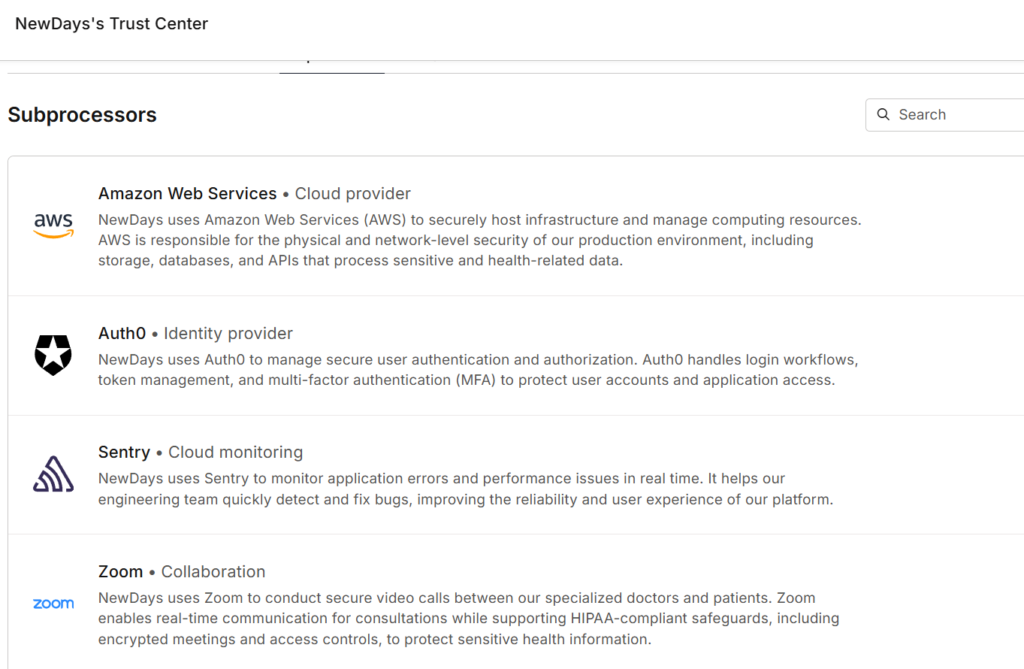
Just from this snippet, you can already see they use AWS for cloud infrastructure, Auth0 for authentication, Sentry for error monitoring, and Zoom for video calls. Four confirmed tools in 30 seconds of reading.
Some companies have 50+ subprocessors listed. If the list is long, paste the whole thing into ChatGPT or Claude and ask it to group them by function. This is what AI is for, right?
Where to find these lists:
- Google “[company name] subprocessors”
- Look for links labeled “Trust Center,” “Security,” or “Privacy” in the website footer
- Check their privacy policy – sometimes the list is buried at the bottom
The link is usually in 99% of cases somewhere in the footer. For example, here’s the Trust Center link in Canva‘s homepage (labeled “Trust Centre”):

Not every company publishes one. But when they do, it’s one of the most honest signals you’ll find. No guessing, no inference – just a list of vendors they’ve contractually committed to using.
2) Check their status page
Many companies run a public status page – usually at status.company.com or hosted on a service like Statuspage, Instatus, or Betteruptime. These pages are designed to show customers whether services are up or down. But if you look closer, they leak a surprising amount about what’s under the hood.
There are two things worth looking at:
The components list tells you about their infrastructure
Status pages usually break things down by component or service. The way a company structures these components tells you what cloud providers they use, how they separate environments, and what they consider critical infrastructure.
For example, here’s Dynatrace’s status page:
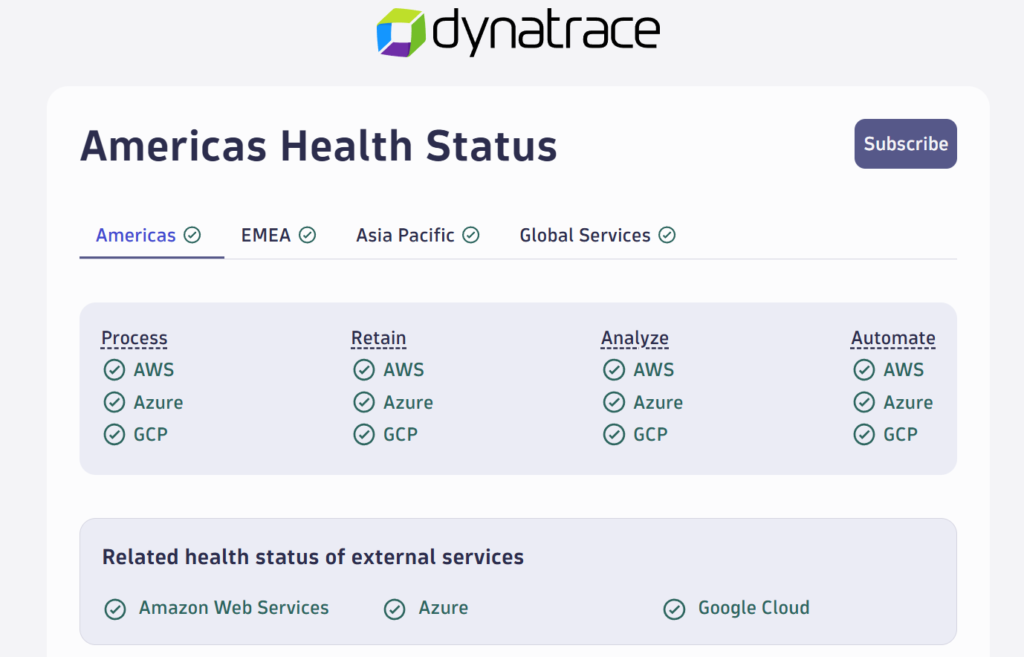
Just from this screenshot, you can see they run on AWS, Azure, and GCP simultaneously, they separate their infrastructure into Process, Retain, Analyze, and Automate functions, and they operate across Americas, EMEA, and Asia Pacific regions. That’s a detailed picture of their architecture from a page that’s meant for customer communication.
Incident history reveals hidden dependencies
The other goldmine is the incident history. When things break, companies often explain why – and that explanation frequently names the upstream vendor or tool that caused the problem.
This is especially useful for finding tools that are otherwise nearly impossible to detect. Security products like CrowdStrike, for example, don’t show up in DNS records, frontend JavaScript, or job postings. No scanner will ever find them.
But you know what happened on July 19, 2024 – CrowdStrike pushed a faulty update that took down systems worldwide. And when that happened, companies posted about it on their status pages.
Here’s Marigold’s status page from that day:
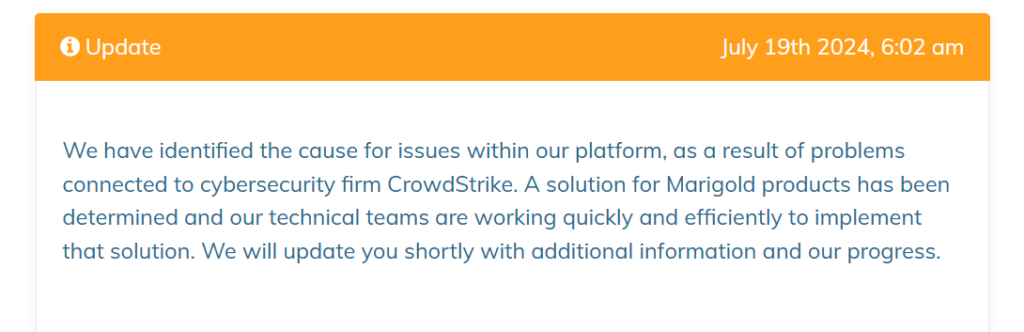
They explicitly state the issues were “connected to cybersecurity firm CrowdStrike.” That’s a confirmed vendor relationship that no scanner, no DNS lookup, and no job posting would have ever revealed.
This is a sneaky but powerful technique: if you know a tool had a major outage on a specific date, you can search status pages for companies that reported issues on the same day and mentioned that tool by name. Suddenly you have a list of confirmed customers that no technographic database in the world would have caught.
To find a company’s status page, just Google “[company name] status page” or try status.company.com. Most mid-size and larger companies have one.
3) Analyze historical job postings
When a company hires for a role, they’ll often list the exact tools that person will be using. And this isn’t just engineering roles – sales ops postings mention CRMs, marketing roles mention automation platforms, data analyst postings mention BI tools. Every department leaks tech stack information when they hire.
The problem is that many job postings turn into buzzword soup. You’ll see things like “must know AWS, Google Cloud, Oracle Cloud, Kafka, Splunk, Elasticsearch, Grafana” all in one paragraph. That doesn’t mean they actually use all of those day to day. Sometimes it’s aspirational. Sometimes it’s copy-pasted. Sometimes it’s HR hedging.
So how do you figure out what they really use?
Frequency. If Salesforce shows up in every sales and marketing posting, that’s their CRM. If Snowflake appears across data engineering and analytics roles, that’s their data warehouse. If something only shows up once, it’s probably optional, legacy, or team-specific.
To do this well, you need at least 8–10 job postings. And that’s where things usually break down – most companies only have a couple of active listings, and old ones get taken down from LinkedIn and career pages.
Enter one of my favorite tools: the Wayback Machine.
The Wayback Machine archives old versions of web pages, including job listings and career search pages. Paste a company’s careers URL into it (*not* an individual job url) and you can browse snapshots going back years. Open old postings that are no longer live and collect the technologies mentioned across many roles and time periods.
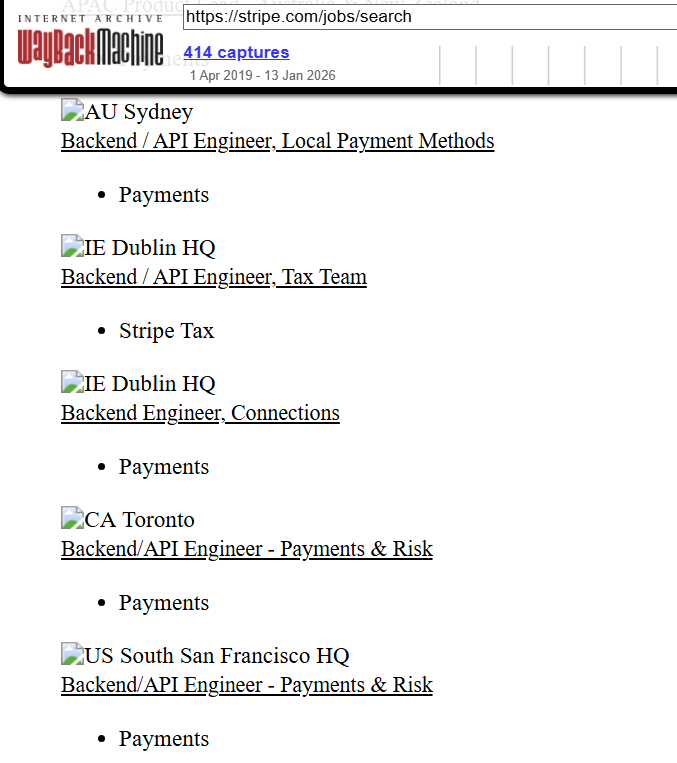
The above is what the Stripe careers page looked like in a prior 2025 snapshot. You can click on any job posting and see exactly what it said on that date.
Copy the text from multiple postings, paste it into ChatGPT, and ask it to extract and count technology mentions. If Kafka, Elasticsearch, and Grafana show up everywhere, that’s the real stack. If Oracle Cloud shows up once in a single posting from three years ago, you can safely ignore it.
Sales tip: Don’t just look at engineering roles. A “Revenue Operations Manager” posting that mentions “HubSpot, Outreach, and Snowflake” tells you exactly what their sales and marketing stack looks like. A “Customer Success” posting mentioning “Gainsight” or “Vitally” tells you what CS platform they run. Every department’s job postings leak useful intel.
This works especially well for large companies that hire continuously. Their job postings are one of the most honest, long-term signals of what they actually use.
4) Look at employee LinkedIn profiles
People love listing technologies on their LinkedIn profiles. Engineers do it to attract recruiters. Sales ops people do it to show they’re “technical.” Marketing people do it because they’re proud of the automation stack they built. And all of it tells you exactly what tools their employer runs.
Browse 5–10 profiles from a company and you’ll see patterns fast. Experience descriptions like “Built data pipelines using Airflow and dbt” or “Managed lead routing and scoring in HubSpot” are direct signals that those tools are part of the production stack.
Don’t forget to check the Skills & Endorsements section too. People endorse each other for specific technologies, so if you see multiple people at the same company endorsed for Salesforce, Tableau, and Snowflake, that’s a pretty clear pattern.
How to find the right profiles
You can search directly in LinkedIn, but LinkedIn’s search filters are frustratingly broad. You can filter by department (like “Engineering” or “Information Technology”), but you can’t get more granular than that. You can’t easily search for just the data engineers or just the SREs.
A better approach is to use Google:
site:linkedin.com/in/ "company name" data engineer
site:linkedin.com/in/ "company name" site reliability
site:linkedin.com/in/ "company name" revenue operations
This bypasses LinkedIn’s limited filters and lets you target specific roles. Swap out the job title for whatever part of the stack you’re curious about: “ML engineer” if you want to know their AI tools, “DevOps” if you want infrastructure, “revenue operations” or “sales ops” if you want their go-to-market stack.
Want to know which CRM they use? Just Google it.
Here’s a dead-simple trick: if you want to know whether a company uses HubSpot or Salesforce, just search Google for both and compare results:
site:linkedin.com/in/ "company name" "HubSpot"
site:linkedin.com/in/ "company name" "Salesforce"
If 15 employees mention Salesforce and 2 mention HubSpot, you have your answer. This works for any technology you’re trying to verify – Zendesk vs Intercom, Snowflake vs Databricks, Marketo vs Pardot. Just compare the mention counts.
If you’re in sales, you probably already live on LinkedIn, which makes this a natural fit. You’re not doing anything unusual – just reading public profiles.
5) Check their GitHub, NPM, and Hugging Face repos
This one takes about 60 seconds. Many companies have public repositories on GitHub, published packages on NPM, and organization pages on Hugging Face. Each of these is a goldmine of information about what they actually build with.
GitHub
Start by going to github.com/{company-name}. Even if the company doesn’t link to their GitHub from their website, you can often guess the URL. For example, github.com/mongodb, github.com/stripe, github.com/airbnb. Try the obvious names first – it usually works.
Once you’re on their org page, there are a few things worth looking at:
- The language breakdown. GitHub shows a bar of languages used across public repos. If a company has 40 repos and 35 of them are in Go, that tells you something very clear about their backend.
- Public repos. Look at the names and descriptions. Companies often open-source their internal tools, client libraries, or infrastructure components. If you see repos like
company-kafka-connectorcompany-terraform-modules, those are real technologies they use in production. - Dependency files. Open any repo and look for
package.json,requirements.txt,go.mod,Gemfile, orbuild.gradle. These files literally list every dependency the project uses. You don’t need to understand the code – just read the list of package names.
Detecting AI coding agents/tools used by a company
Another cool thing you can infer from a company’s Github repo is their stance towards AI coding tools. This is especially useful if you’re preparing for a coding interview, and not quite sure if they allow you to use an AI coding tool, or which ones they allow.
You can do this by looking at what files exist in the root of the rep, as they’re a direct fingerprint of which AI tools the team uses day-to-day.
Here’s what to to look for:
.cursor/(directory) or.cursorrules– They use Cursor.CLAUDE.md— They use Claude Code..github/copilot-instructions.md— They use GitHub Copilot’s workspace instructions feature, which lets teams customize Copilot’s behavior per repo..windsurfrules– They use Windsurf..roomodesor.roo/** -They use Roo Code..aider.conf.ymloraider.conf.yml– They use Aider, an open-source AI coding tool popular with more technical/developer-first teams.
The content of these files is often more valuable than their mere existence. A .cursorrules or CLAUDE.md file that’s detailed and well-maintained tells you the team has invested in AI-assisted development workflows, and it frequently leaks exactly what frameworks, patterns, and conventions they care about.
NPM
If the company publishes JavaScript packages, you can find them on npmjs.com/~{company-name} or by searching their name on npmjs.com. Published packages reveal what frameworks they use and what internal tools they’ve built. For example, a company publishing a React component library tells you they’re a React shop.
Hugging Face
This one is especially useful if you’re researching a company’s AI/ML capabilities. Go to huggingface.co/{company-name} and look at their organization page.
You can see:
- Models they’ve uploaded or fine-tuned – this tells you what model architectures they work with and what tasks they’re solving (text generation, embeddings, classification, etc.)
- Datasets they’ve created or published – this reveals what kind of data they work with and what problems they’re focused on
- Spaces they’ve built – these are demo apps, which show you what frameworks they use (Gradio, Streamlit, etc.) and what they’re prototyping
- Team size – the number of members in their Hugging Face org gives you a rough sense of how big their ML team is
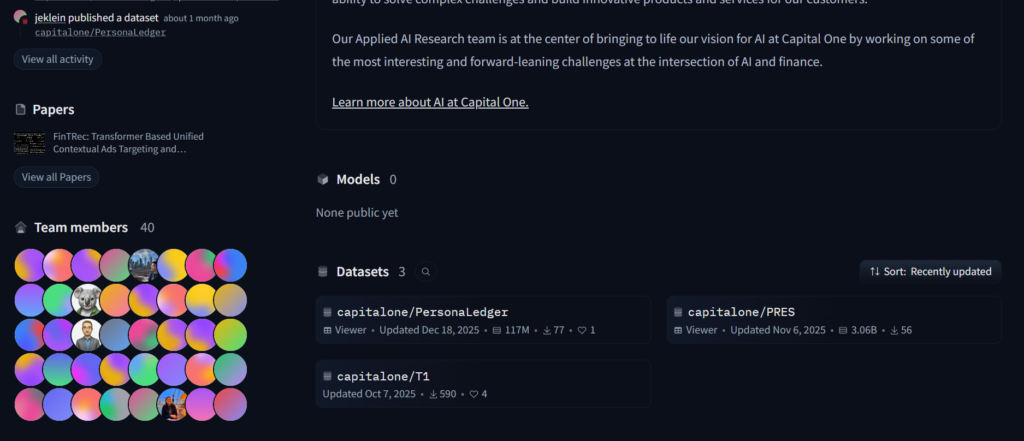
For example, when I browsed to CapitalOne’s Hugging Face profile, I could see that they have a fairly large machine learning team (over 40+ employees)
Not every company will have a public presence on all three of these platforms. But when they do, it’s some of the most direct evidence you’ll find of what they actually use – because it’s code they actually wrote and published.
6) Look up their DNS TXT records
If you’ve worked at any mid-size or large company, you probably don’t log in with a username and password for every tool. You log in with SSO – usually SAML, sometimes OAuth. Before that works, the SaaS vendor needs proof that your company actually owns the domain.
The most common way to do this is by adding a TXT record to their DNS. That record isn’t optional or decorative – someone on the IT or security team had to explicitly add it so the integration could go live.
This is why DNS TXT records are such a strong signal. If a verification record exists, the company is almost certainly using that product.
To find them, use a free tool like DNSChecker and look up all TXT records for the domain. No login required, no payment.
As an example, here are some of the TXT records for openai.com:
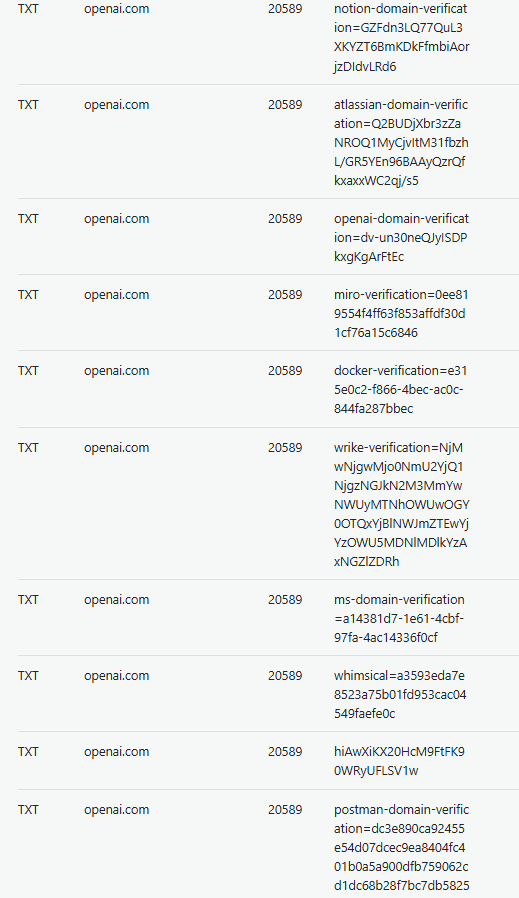
There’s a lot you can infer here:
notion-domain-verification→ Notionatlassian-domain-verification→ Jira, Confluencemiro-verification→ Mirodocker-verification→ Dockerwrike-verification→ Wrikems-domain-verification→ Microsoft (Azure AD, M365)postman-domain-verification→ Postman
If you’re in sales and you see hubspot-domain-verification in someone’s DNS records, congratulations – you now know their CRM without asking. Same goes for salesforce-domain-verification, marketo-domain-verification, or zendesk-domain-verification. These records don’t lie.
This technique works especially well for companies with SSO-heavy environments, because every SaaS product needs its own verification. Paid tools like Wappalyzer often miss these entirely because they focus on front-end detection instead of configuration data.
Part 2: Finding frontend technologies (browser dev tools)
The techniques above require zero technical skill. The ones below require you to open Chrome’s developer tools – nothing more. If you’ve never done that before, all it takes is right-clicking on a page and clicking “Inspect.” You’ll learn a lot about a company’s frontend frameworks, analytics stack, observability tooling, and customer data tools.
7) Extract third-party domains from network calls on their website
Every time a website loads, it pulls in scripts, images, and data from dozens of third-party services. Each of those services has its own domain. By extracting the list of domains a site talks to, you get a map of their frontend tooling.
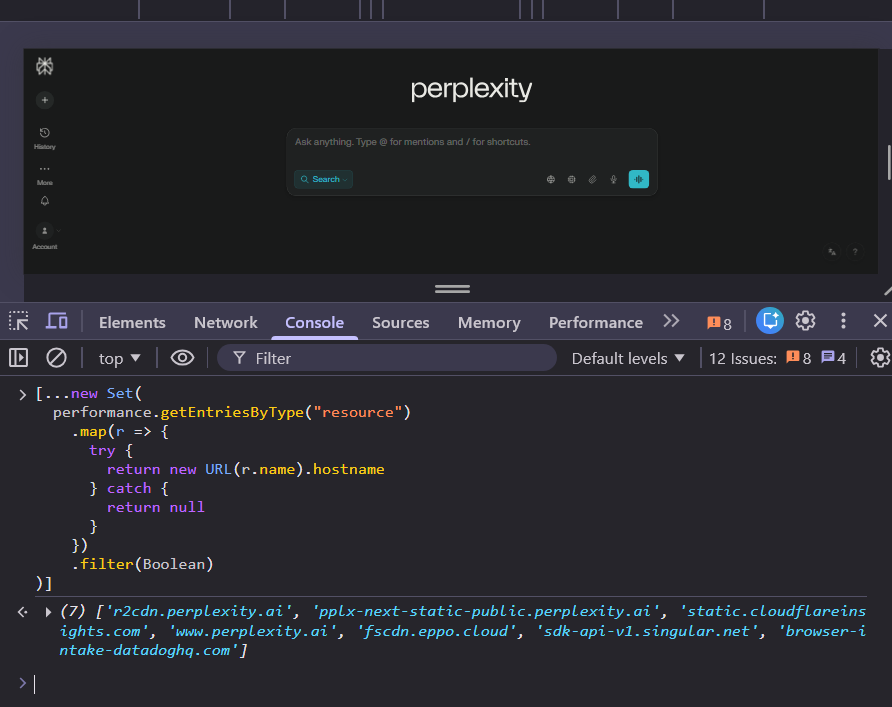
Here’s how to do it: go to the company’s website in Chrome, right-click anywhere on the page, click Inspect, and go to the “Console” tab. Then paste this JavaScript snippet:
[...new Set(
  performance.getEntriesByType("resource")
    .map(r => {
      try {
        return new URL(r.name).hostname
      } catch {
        return null
      }
    })
    .filter(Boolean)
)]
You’ll get back a list of every third-party domain the page loaded resources from. Here’s what I see when I do this on perplexity.ai:
Why not just use Wappalyzer for this? Because new frontend tools come out constantly and Wappalyzer doesn’t update their detection code fast enough. An LLM has broader knowledge of newer tools and can do the domain-to-product conversion more accurately.
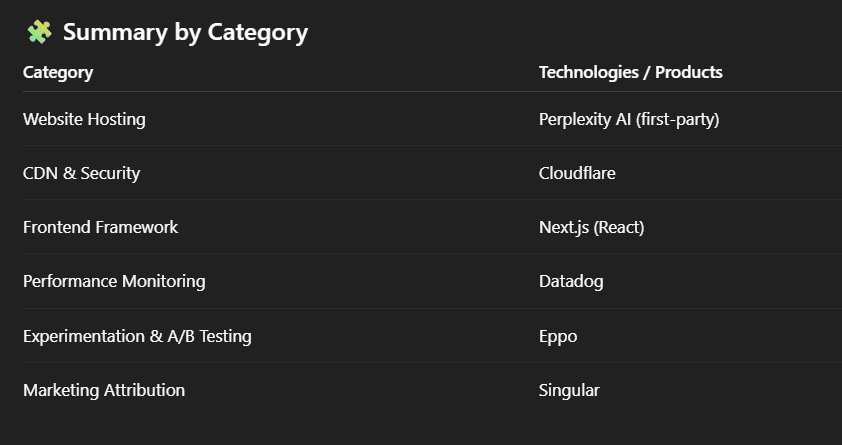
Paste the list into ChatGPT or Claude and ask it to identify the technologies. When I did this for Perplexity, I found out they use Cloudflare as a CDN, Next.js as their frontend framework, Datadog for observability, Eppo for A/B testing, and Singular for marketing attribution.
Pro tip: If the company has a web app (like app.domain.com), do the same thing after logging in. Web apps often load different libraries than the marketing homepage – things like product analytics and A/B testing tools that only run inside the authenticated experience.
8) Look at the domains in a site’s Content Security Policy
Some websites return a header called Content Security Policy (CSP) on certain requests. It’s a security rule the website sends to your browser that says: “these are the only domains I’m allowed to load things from or send data to.”
If a domain appears in a CSP, the app is explicitly allowed to interact with it. That usually means the company uses whatever service lives at that domain.
What this looks like in the real world
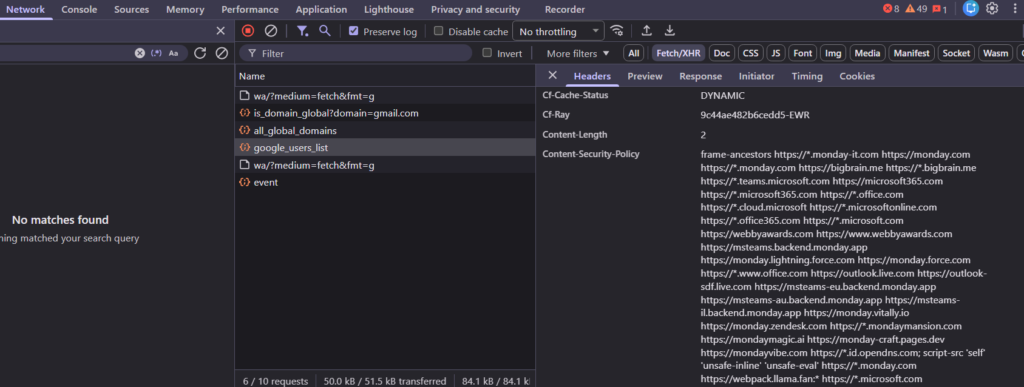
This is from Monday.com. I clicked around the app, opened the Network tab, clicked on each XHR request, and found one that listed a Content-Security-Policy header with a long list of domains:
monday.zendesk.com→ they use Zendeskmonday.lightning.force.com→ they use Salesforcemonday.vitally.io→ they use Vitallymsteams.backend.monday.app→ deep Microsoft Teams integration
How to do this yourself
- Open the website in Chrome
- Right-click → Inspect → Network tab
- Turn on Preserve log
- Reload the page, then click around the site like a normal user
- Filter by Fetch/XHR
- Click on requests and look in the Headers section for
Content-Security-Policy - Copy the entire list of domains and paste it into ChatGPT
Not every website exposes a CSP, and even on sites that do, only some requests will include it. If you don’t see it, move on. But when you do find one, it’s one of the clearest signals you’ll get – a straight list of every service the app is allowed to talk to.
9) Hit their API endpoint and examine the response headers
Most companies expose an API at a predictable URL like api.company.com. Even without credentials, just hitting that endpoint and looking at the error response tells you what infrastructure they use to manage their APIs.
You don’t need to actually use the API. You just need to see the headers that come back.
How to do this: Open Chrome, go to https://api.{company}.com/, and you’ll probably get an error page. That’s fine. Right-click → Inspect → Network tab → refresh the page → click on the failed request → look at Response Headers.
Example 1: Macy’s
Hitting https://api.macys.com/ returns a 596 error. But the response headers reveal:
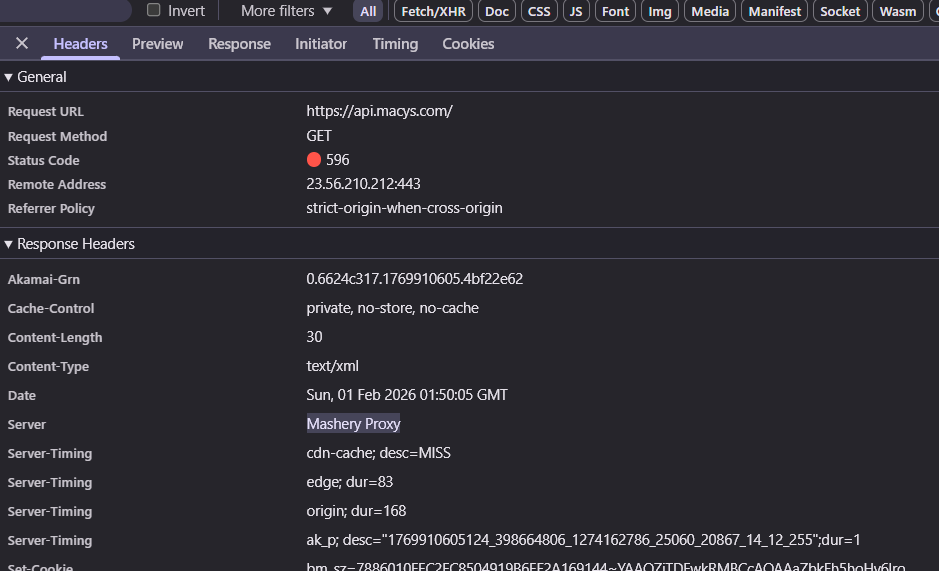
That Server: Mashery Proxy header tells you Macy’s uses Mashery (now part of TIBCO) for API management. The Akamai-Grn header confirms they use Akamai as their CDN.
Example 2: Utilimarc
Hitting https://api.utilimarc.com/ returns a 404. But:
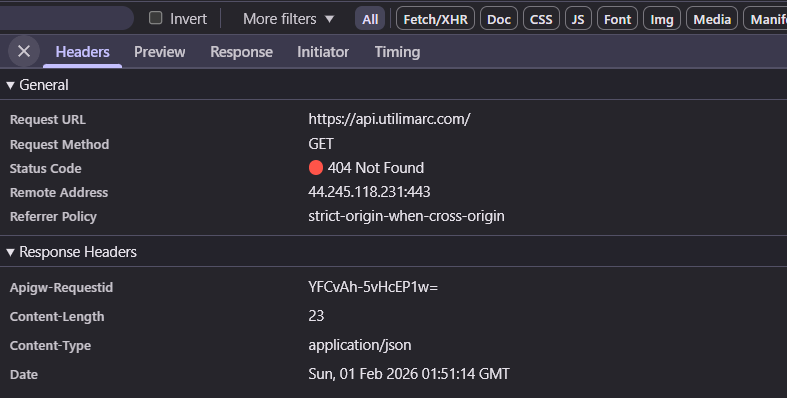
That Apigw-Requestid header is a dead giveaway for AWS API Gateway. Only AWS adds that specific header format.
Here are some common headers and what they reveal:
| Header | What it means |
|---|---|
Server: Mashery Proxy | Mashery/TIBCO API management |
Apigw-Requestid | AWS API Gateway |
X-Kong-* | Kong API Gateway |
X-Azure-Ref | Azure API Management |
X-Amzn-RequestId | AWS (Lambda, API Gateway, etc.) |
Server: openresty | OpenResty (Nginx-based, often used with Kong) |
Server: AkamaiGHost | Akamai |
Server: cloudflare | Cloudflare |
X-Cache: Hit from cloudfront | AWS CloudFront |
Server: Apache or Server: nginx | Self-hosted on Apache/Nginx |
X-Powered-By: Express | Node.js with Express framework |
X-MuleSoft-* | MuleSoft API management |
X-Apigee-* | Google Apigee |
This won’t tell you everything. But if you specifically want to know what a company uses for API infrastructure, this is the fastest way to find out.
10. Read their Segment configuration file
This one only works if the company uses Segment, but a lot of them do.
Segment is a customer data platform that sits in the middle of a company’s analytics stack. It collects events from your website or app and forwards them to every other tool you use: your analytics platform, your CRM, your advertising tools, your data warehouse, and so on.
When a site runs Segment, the browser fetches a settings file that configures which destinations to send data to. You can see it yourself: open DevTools, go to the Network tab, and filter by “segment”. Look for a request called settings and the preview will show you an integrations object that lists every tool they pipe data into.
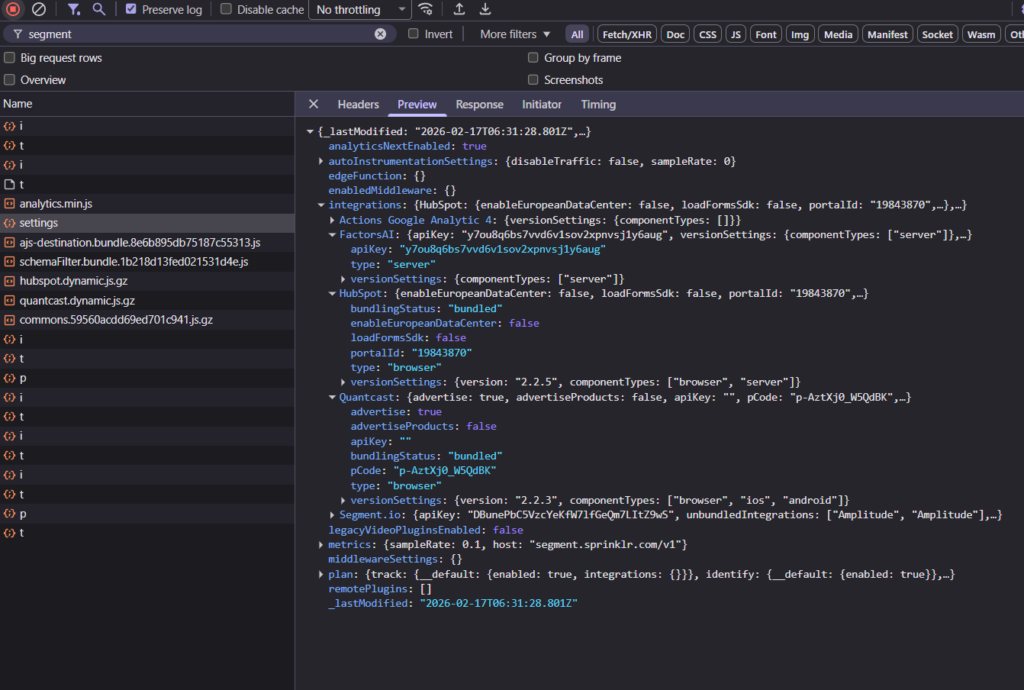
The screenshot above shows a real example: HubSpot (with a portal ID), FactorsAI, Quantcast, Amplitude, and Google Analytics 4 are all visible in plain text, along with their API keys and configuration details.
What you can infer from this:
- CRM: HubSpot or Salesforce showing up here means that’s their CRM or marketing automation platform
- Analytics: GA4, Amplitude, Mixpanel, Heap, whichever appears tells you what they use for product analytics
- Advertising: Quantcast, Facebook Pixel, or Google Ads showing up means they’re running paid acquisition on those channels
- Data infrastructure: If you see BigQuery or Snowflake, they have a more mature data stack
The config is public by design. It has to be, because it loads in the browser. You’re not doing anything unusual by reading it. You’re just paying attention to what’s already there.
Part 3: Advanced methods for backend infrastructure
Everything above focuses on what you can see from the outside: public repos, LinkedIn profiles, browser requests, DNS records. The techniques below go a level deeper into infrastructure reconnaissance. They reveal backend systems like message queues, databases, internal microservices, and cloud providers – stuff that never shows up in a browser.
11) Enumerate internal subdomains of a domain
One place companies accidentally expose a ton of information is their subdomains.
Most companies don’t run everything on www.company.com. As systems grow, they split things up. Different services get their own subdomains so they can be owned by different teams, deployed independently, and locked down with different security rules. That’s why you’ll see names like auth.company.com, billing.company.com, kafka-prod.company.com, or elastic.company.com.
These names aren’t random. They usually describe exactly what the service does. A list of subdomains often tells you more about a company’s real infrastructure than any paid scanner ever will.
How to find subdomains
A very easy way is with pentest-tools.com. They give you two free reports, which is more than enough for research. Drop in a domain and you get a list of discovered subdomains.
For example, here’s what you get for nokia.com:
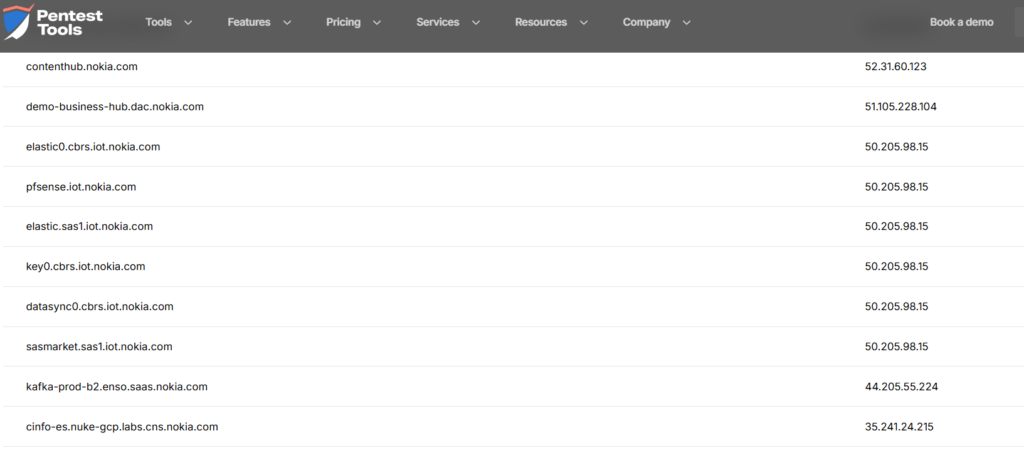
Just reading the names tells you a lot:
elastic0.cbrs.iot.nokia.com→ they use Elasticsearchkafka-prod-b2.enso.saas.nokia.com→ they use Kafkapfsense.iot.nokia.com→ they use pfSense- multiple
iot.subdomains → they have IoT-specific infrastructure
This doesn’t work for every company – some lock it down tightly, some subdomains are boring or generic. When it works, it works very well. When it doesn’t, move on.
Go one step further: find their cloud provider
Once you have subdomains, plug a handful of them into dnschecker.org and look at the A record. DNS Checker will usually tell you who owns the IP address.
For example, looking up kafka-prod-b2.enso.saas.nokia.com:
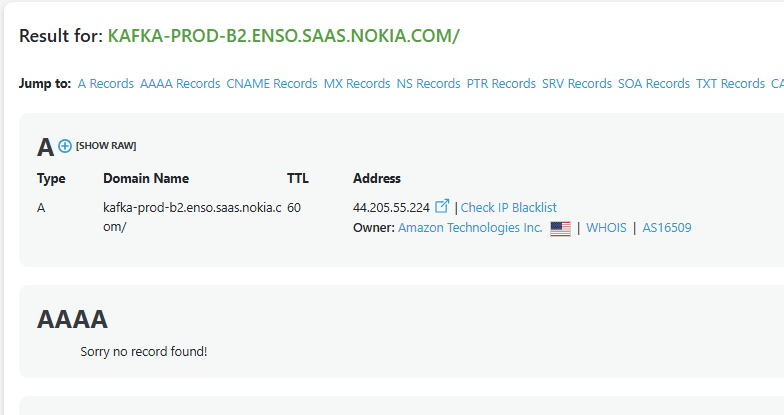
The IP is owned by Amazon Technologies Inc. – a strong signal this service is running on AWS. Repeat for a few different subdomains and patterns emerge quickly. If most resolve to Amazon, Google, or Microsoft IP ranges, that’s where the bulk of their infrastructure lives.
Can’t find any subdomains? Just try the most popular ones
Even if a subdomain enumeration tool doesn’t give you a whole lot of subdomains, a lot of companies use the same naming convention.
For example, here are some popular ones you can try:
help.domain.com and support.domain.com: Put this into DNS Checker and pay attention to the CNAME. Often times, if they’re using a 3rd party support tool like Intercom, or Pylon, you might see references to it there.
helpdesk.domain.com and servicedesk.domain.com: Again, put this into DNS Checker and see if the CNAME reveals what ITSM they’re using, whether it’s Atlassian Jira Service Desk, ServiceNow, etc.
auth.domain.com: You might see references to an auth provider they use, whether it’s Auth0, or Clerk.
vpn.domain.com: You might see references to a VPN provider like Global Protect from Palo Alto, or FortiClient.
This list from Github is also a good starting point for popular subdomains across the web: https://github.com/danielmiessler/SecLists/blob/master/Discovery/DNS/subdomains-top1million-110000.txt
12) Search Cisco Umbrella’s DNS popularity logs
This one feels like finding a secret door in a video game.
Cisco operates one of the largest DNS resolver networks in the world through their Umbrella service (formerly OpenDNS). Every time someone on their network visits a website, that DNS query gets logged. Every day, Cisco publishes a ranked list of the most popular domains and subdomains that flow through their infrastructure. It’s called the Cisco Umbrella Popularity List, and it’s completely free.
Why this is different from subdomain enumeration: The tools in the previous section find subdomains that exist. The Cisco Umbrella list shows subdomains that are actively being used, based on real traffic. This means you’ll catch things like third-party SaaS platforms with company-specific subdomains, or internal tools that only employees access.
Download the list from Cisco’s public S3 bucket:
http://s3-us-west-1.amazonaws.com/umbrella-static/top-1m.csv.zipUnzip it and you’ll get a simple CSV with two columns: rank and domain. Open it in any spreadsheet tool and search for the company name you’re researching.
When I searched for “autodesk,” I found entries like:
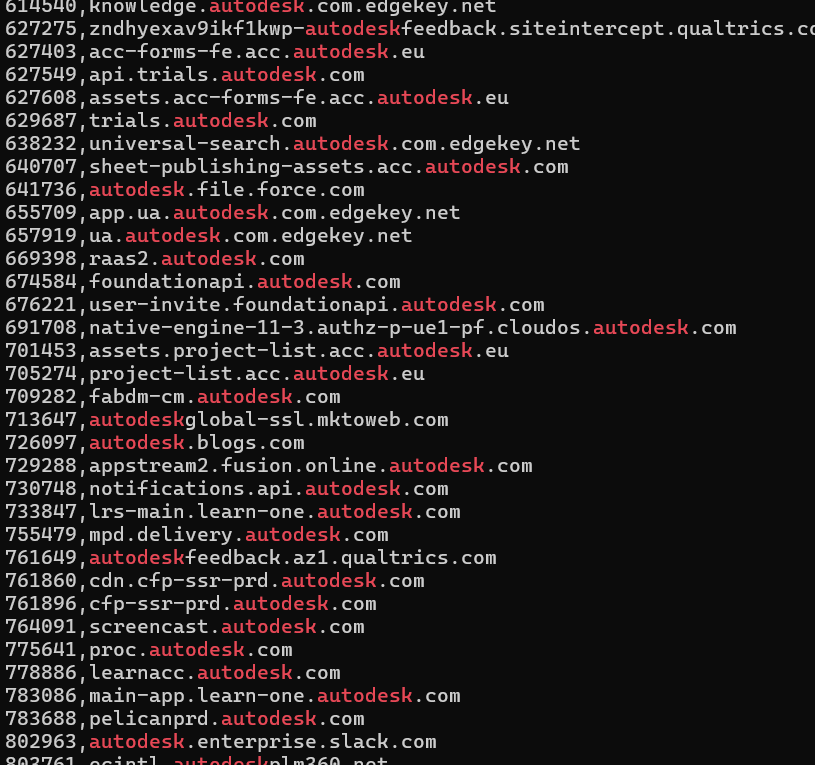
autodeskfeedback.az1.qualtrics.com→ they use Qualtrics for surveysautodesk.enterprise.slack.com→ they use Slack Enterprise Gridautodesk.file.force.com→ they use Salesforce*.autodesk.com.edgekey.net→ they use Akamai as a CDNautodeskglobal-ssl.mktoweb.com→ they use Marketo for marketing automationnotifications.api.autodesk.com→ they have a dedicated notifications API
You’ll also catch internal-looking subdomains that standard enumeration tools would have missed, like proc.autodesk.com or foundationapi.autodesk.com.
Caveat: This only works for companies with enough traffic to appear in the top million. Smaller startups probably won’t show up. But for mid-size and enterprise companies, it’s a goldmine of real-world infrastructure signals that paid technographic tools never bother to check.
Conclusion
If you want surface-level answers, subscribe to Wappalyzer. It’ll tell you a company uses jQuery and Google Analytics, which is about as useful as telling someone a restaurant has tables and chairs.
If you want actual tech intelligence, here’s the path:
- Read subprocessor lists and Trust Centers
- Analyze job postings (current and historical via the Wayback Machine)
- Browse employee LinkedIn profiles for technology mentions
- Check their GitHub, NPM, and Hugging Face repos
- Look up DNS TXT verification records
- Extract third-party domains from network calls
- Check Content Security Policy headers
- Inspect API response headers
- Enumerate subdomains and trace them to cloud providers
- Search real DNS traffic logs via Cisco Umbrella
You don’t need to pay. You don’t need to be an engineer. Half of these techniques require nothing more than reading a webpage or Googling a LinkedIn search. And when you combine a few of them together, you’ll know more about a company’s stack than their own vendor reps do.
The paid tools scrape the surface and call it a day. Meanwhile, the real stack lives in DNS records, CSP headers, job postings, GitHub repos, and traffic logs that they never bother to check.
Every technique in this guide is free. Most take less than five minutes.